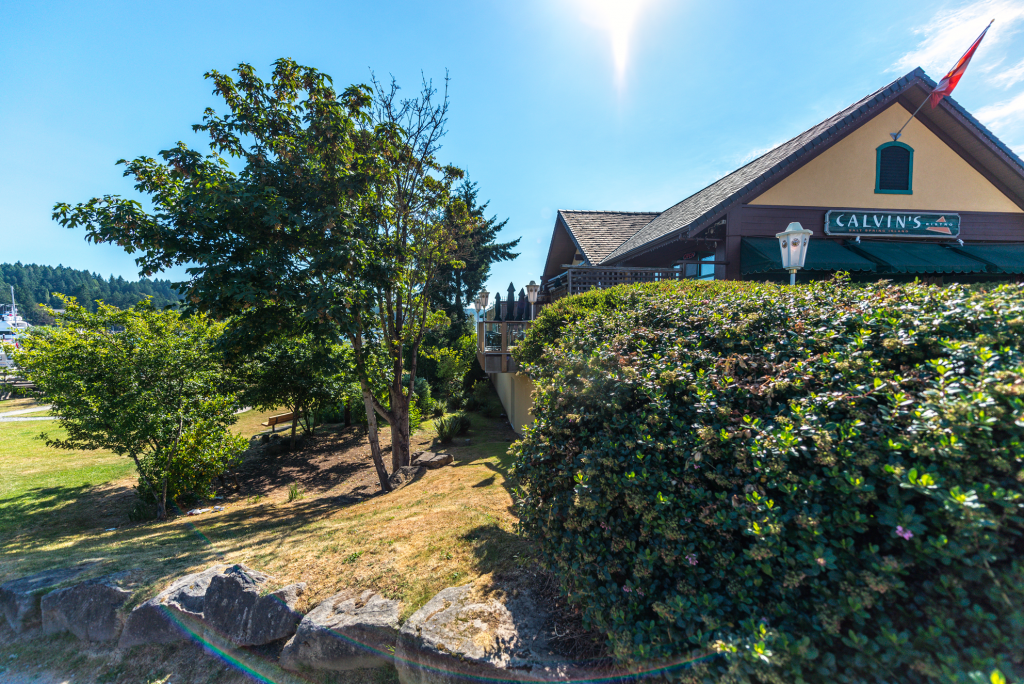
Tag Archives: opportunity

Market Analysis, April 2017, Salt Spring Island

Salt Spring Island

Salt Spring Island

April 2017

We experienced the yin and yang of a La Niña weather pattern on the Pacific Northwest Coast…from early December to mid-March.

Salt Spring fell into “real winter” on December 3, 2016 and experienced yet another serious snowfall on March 5, 2017. In between: snow, cold, with ice build-up remaining on roads between the frequent snow storms, only main roads to ferries cleared (side roads and driveways on their own). There was skating on the lakes…that was a fun item. The last time the Coast experienced the La Niña effect was in 1996.

The entire Coast was affected, including Vancouver. The weather did affect real estate viewings…potential buyers couldn’t get out of where they were, never mind not being able to easily get around on Salt Spring!

December, January, February, and first half of March (higher elevation properties only saw the “melt” begin around March 12th) caused a slowdown in new action. Many of the reported sales of early 2017 had their beginnings in late Fall of 2016.

Although we often describe Salt Spring and the Gulf Islands main sales window as falling between March Break and the Canadian Thanksgiving Weekend, the reality is that the busiest months are May, July, August, September.

The Islands are secondary home/discretionary/recreational markets…I call them recipient markets. Sellers have to wait for a buyer to first visit, then decide if a particular island works for them, and then to really start their search for a specific property. Time is always an element of sales in all secondary home/recreational regions.

That said, it’s clear that 2016 was a sales volume increase year…a cleaning out of inventory that had built up during the eight year economic downturn. Prices stabilized, but did not increase.

In a “by choice” area, such as Salt Spring (and the Gulf Islands), there is always a time lag component in sales outcomes.
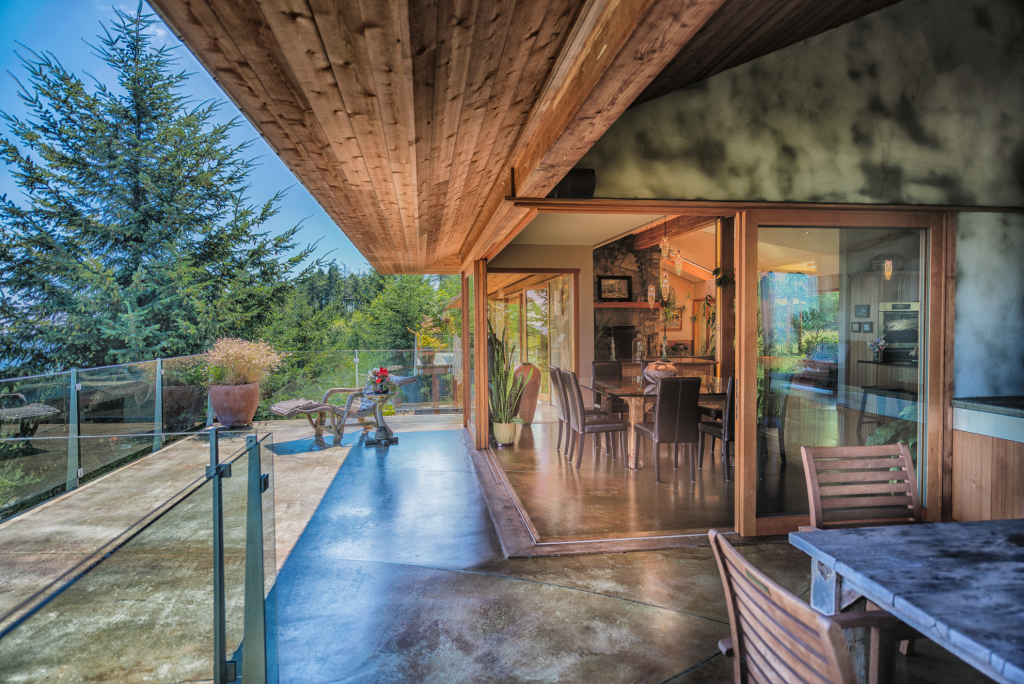
Salt Spring Island

Salt Spring Island

Often, a tourist with a successful visitor experience becomes a buyer in our region. Usually two, if not three, visits take place before a purchase decision. The non-local buyer wants to “be sure”, before committing to a purchase. When a property sells quickly, it often means that a property is listed exactly when a buyer has returned for that second or third decision-making visit.

With less inventory to choose from, however, we may now start to experience some bidding wars, IF a property is unique.

2017 has had a slow start, solely due to the unusual weather vagaries, but all signs are there for further inventory clean-out (especially in the upper tier priced residential properties and in the undeveloped land segment). After that? No crystal ball, but the signs are definitely in place for price increases in any new (and potentially few) new listings.

The tone of 2017 may be fully in place by late May. It may be that buyers who acted in the first three months of this year will turn out to have been the last buyers able to catch a seller’s interest with a lower than list price offer. In other coastal regions, which often catch the wave of change before it’s seen on Salt Spring and the Gulf Islands, the price escalation due to lack of inventory is in evidence.

Between 2000 and 2002, sales volume increased by around 50%. Between 2003 and 2005, prices rose by around 60%. Our dollar was low against the U.S. currency. International buyers were in evidence. Hmmmm…… Similar soundtrack?

Stay tuned.

To date, there have been 55 sales between January 1 and March 31. The first several (below 200,000) were undeveloped lots. The higher end residential did see price reductions at the point of an offer, but residential below 500,000 often sold at (or close to) list pricings.

  • 6 sales between $160,000 and $199,500.
  • 4 sales between $234,000 and $280,000.
  • 8 sales between $305,000 and $396,000.
  • 8 sales between $400,000 and $485,000.
  • 9 sales between $506,200 and $599,000.
  • 5 sales between $625,000 and $690,000.
  • 3 sales between $729,000 and $769,000.
  • 3 sales between $800,000 and $878,000.
  • 2 sales between $900,000 and $945,250.
  • 4 sales between $1,075,000 and $1,750,000.
  • 3 sales between $2,200,000 and $2,500,000.

I do this market analysis at the beginning of each month…updates may appear in my blog entries.

Along with the transition from a buyer’s market (few buyers and many listings) to a seller’s market (few listings and many buyers), there is the Islands Trust (government body in place since 1974, which capped growth on the Gulf Islands via strict zoning/land use bylaws)…the inventory will always be less on a Gulf Island, thus, beyond market trends).

Salt Spring will be asked on September 9th whether or not to retain the status quo (2 elected trustees and one elected CRD director…the actual decisions, however, are currently made from a central Trust office in Victoria…and these government appointees do not reside on Salt Spring), or whether to incorporate as a Gulf Islands municipality (two trustees elected, per usual, plus councillors & a mayor…the Trust documents remain in place, but decisions re governance would be made on Island & not in Victoria). Keep in the loop of the conversation on both sides of this important issue.

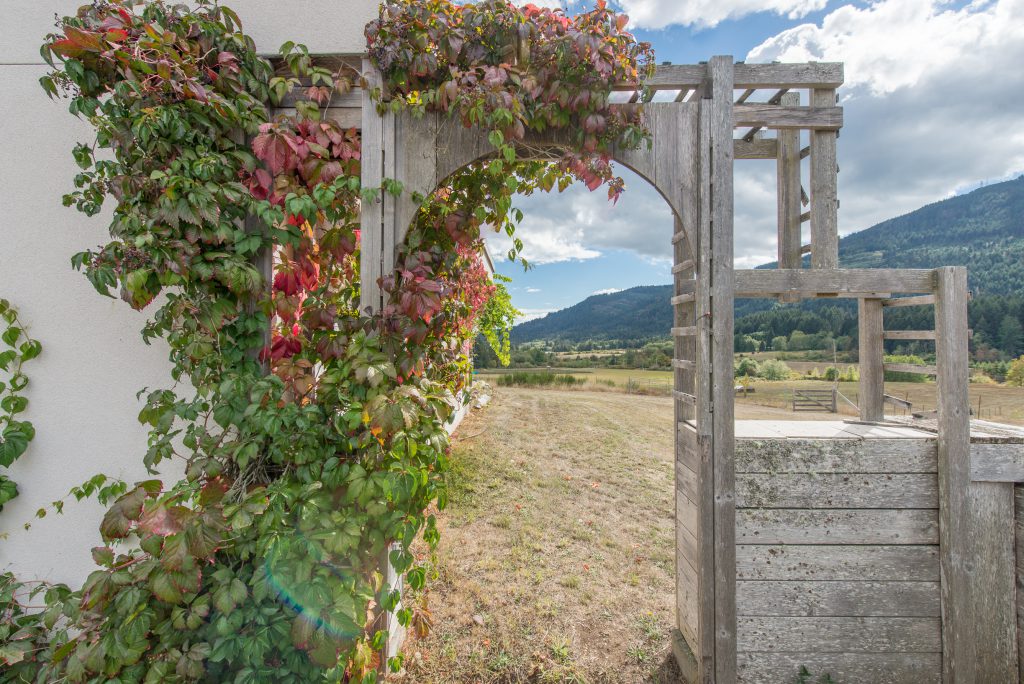
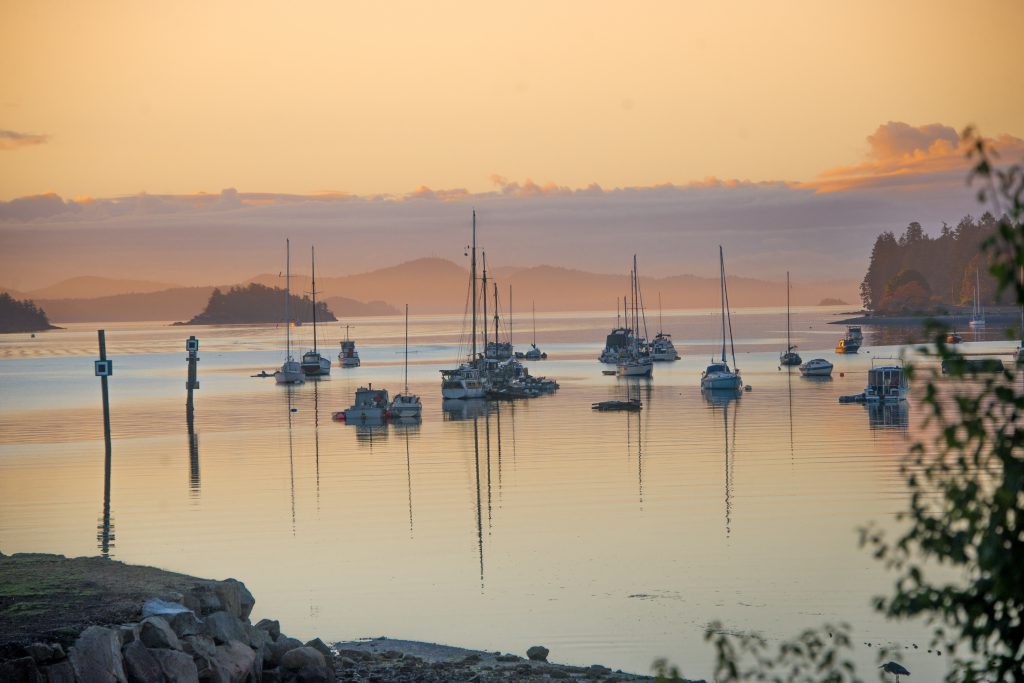
Meantime…the beauty of the Island calls to us. Check out the Food Network’s one hour showcase of Salt Spring…the travelling chefs came last summer and I think they caught the essence of this magical island.

Looking for your special property on Salt Spring Island or on a Gulf Island? Call me. There is always opportunity for a buyer, regardless of market trend in play.

Market Analysis, March 2017, Salt Spring Island

March 2017

So…the season begins….traditionally, March Break to Canadian Thanksgiving Weekend (mid-March to mid-October) offers the traditional grid of real estate sales action in the coastal secondary home (recreational) markets…which includes Salt Spring.

Salt Spring is basically a seasonless market, though, and people visit year round…real estate sales can occur at any time.

If one is seriously for sale, then one needs to “be exposed to the market”. The digital world, which is now where most buyers first encounter a listing, does not recognize weather or time of year. If wanting to sell, it’s important to be found on a buyer search, at any time.

For a buyer, statistics show that they look for property almost 2 years before buying, via Internet sites. Yes, they are “interested”, but not yet “ready”.

About 6 weeks before they are in that “ready” state, they connect with a realtor and make appointments to view what has caught their attention. Once they physically arrive and view, they will see other options, too. Thus, the buyer may or may not purchase the property that first caught their attention.

Hmmm…in secondary home markets, where most buyers are from elsewhere, it often takes two (and sometimes three) visits before a purchase. Since these buyers are often from afar, there can be substantial timelines between visits…sometimes 3 to 4 months, or longer.

Time lags are a part of real estate sales in secondary home/discretionary markets. Days on market are not significant in recreational/by choice regions. Sellers know how long they’ve been listed, but to a buyer who has just started a search, everything is “new”. If a newly listed property sells quickly, it often means that a buyer has turned up for that second or third visit, right at the time the listing came onstream.

So many changes to the real estate industry, all of them driven by technological shifts, but some things remain the same…especially in the recreational/discretionary regions.

Customer service, knowledge of the area (both inventory and market trends), negotiating skills, an authentic interest in a consumer’s concerns, knowledge of zoning/bylaw issues (very important on a Gulf Island, which is governed by the Islands Trust), a good short-list of qualified professionals to aid the consumer (property inspectors, legal advisors, septic installers, water test labs, architects, contractors, mortgage advisors, etc)…a local realtor understands the area and can interpret the many local issues.

An Internet search is helpful, but some items in a recreational region are best discussed with a knowledgable & experienced local realtor. That interpreter function is an essential addition to any internet based information.

Market trends: like any market, real estate also experiences that wave-like model…up and down and somewhere in between. Markets are never static.

The global downturn of late 2008 lasted for almost 8 years in our local region…some areas saw recovery much earlier. For Salt Spring and the Southern Gulf Islands, the recovery began in mid-March, 2016. There were earlier whispers of action in late 2015, but a marked upsurge in residential sales volume began in early Spring, 2016. By year’s end, inventory had thinned out and prices had stabilized.

A seller’s market is characterized as low inventory coupled with high buyer demand. This scenario can lead to price escalation.

This early in the season, it’s too soon to speculate on price points. All that can be said is that there might only be two or three property options currently on the market that will suit a buyer. Thus, the seller may benefit by achieving list price or close to it. If this lack of inventory trend continues, then price escalation may be a factor by the Fall Market.

There is always opportunity for a buyer, regardless of market trend in play. Creative ways to buy that special property, in a recreational area, can always be found…even in a seller’s market.

Market Analysis, January 2017, Salt Spring Island

January 2017

The real estate market shows its tone by mid-February, in our secondary home marketplace. It seems that the first six weeks of a New
Year continue the tenor of November and December of the previous year.

A resurgence in sales, a thin inventory, a stabilizing of prices….these are continuing signs of a market uptick. An increase in tax assessments that reflect strong sales in the previous year…such assessments are mailed out to property owners in early January…is another marker.

It is wise to allow January and early February to unfold. The secondary home markets see their busiest moments between mid-March and end of October. Best, perhaps, to let the first weeks bring forward the clues to the rest of the year.

So, attend conferences that offer arrows of information about the future. Pay attention. Be aware of shifts and changes.

It’s the fallow field moment: the roots are busy, but nothing yet shows above ground.

Salt Spring and the Gulf Islands remain extraordinary places to visit, to enjoy, to choose as special places to live. They are “seasonless” experiences.

Market Analysis, September 2016, Salt Spring Island

Salt Spring Island

Salt Spring Island

Beginning of the Fall Market

So…we begin the Fall Market…here it is, the beginning of September. The calendar says summer goes on till the 20th, but most of us see Labour Day Weekend as the “end”.

Sales volume in the Spring/early Summer market has gone up markedly on Salt Spring Island, in residential properties below $750,000. Over that price point, it remains softer.

In that entry-level residential segment, though, it could be described as sellers market conditions.

What does a seller’s market mean? Limited inventory plus strong buyer demand creates a seller’s market. Price escalation occurs with lack of product.

In a Gulf Island region, there is always a limited inventory

In a Gulf Island region, there is always a limited inventory. The Islands Trust, a provincial government body created in 1974, with the mandate to “preserve and protect” the environmental beauties of the Gulf Islands, for the benefit of all B.C. residents, also effectively “capped” growth.

On Salt Spring Island

On Salt Spring Island

Growth in the Gulf Islands is controlled by strict zoning/density bylaws. On Salt Spring, commercial zoning is focused in both upper and seaside Ganges Villages, and they can’t expand beyond their boundaries. The small commercially zoned options at Vesuvius, Fulford, and Fernwood cannot expand. Home occupations are encouraged, but there are rules around these usages, too.

As soon as growth is limited, values do appreciate over time. Between 2002 and 2005, prices escalated by around 60% on Salt Spring. Then a pause developed in 2006 and 2007. Late 2008 delivered the global economic downturn, and secondary home/recreational areas (globally) saw a sharp fall-off in activity. Between early 2009 and early 2015, prices locally had reduced by around 45%.

Buyers who acted between 2013 (the “worst” year?) and late 2015, have benefitted by that dramatic levelling off of prices, in the secondary home markets. It’s difficult for people to act before clear signals of a market shift are in place…those who do act seem to have that “wolf’s sniff the wind” directional arrow.

Important always, though, to be looking down the highway and not in the rear view mirror…opportunity is ahead.

By late 2015, one could see an improving trend coming into play in the secondary home markets. The Sunshine Coast and the Okanagan saw renewed activity in the Fall of 2015. Early Spring brought action to Victoria and to some Vancouver Island communities. Mid-Spring delivered activity to the Gulf Islands. Salt Spring (perhaps because of its year-round lifestyle opportunities) usually shows market improvement first, among the Gulf Islands choices.

The interesting thing is the change in the buyer profile for Salt Spring and the Gulf Islands: almost 100% from Vancouver.

Traditionally, a Gulf Island buyer has come from Alberta (perhaps 20% of coastal buyers?) or from the U.S. (perhaps 30% of coastal purchasers?). This time, it’s buyers from Vancouver, who have sold during the extremely “hot” market there. They are seeking new areas to reside…not just recreational/seasonal buyers, thus.

These previously Vancouver based buyers will live here year round, and that has all sorts of good outcomes for the day to day business life on the Island. Shop Local becomes a viable item when there is a year round resident, and not just a seasonal impact.

Within the past 11 weeks, sales volume dramatically rose (perhaps tripled?) in the entry-level residential segment. On Salt Spring, that would be between 300,000 and 750,000. Low inventory with high buyer demand leads to price escalation. Couple that with an area with a no-growth policy (Islands Trust) and you can see that we may be returning to that 2002 to 2005 model.

Opportunity continues to exist in upper tier priced residential, in undeveloped lots and acreages, in recreational cottages/cabins, and in commercial options. These market segments have not yet seen the quick sales of the entry level priced residential properties. As these property categories start to sell (and they are slowly becoming more and more active), and inventory begins to thin out, price points will also stabilize/rise.

The sales stats to date break out as follows.

January 1 to August 28 “solds to date”:

  • 26 sales between 1 and 200,000.
  • 29 sales between 2 and 300,000.
  • 47 sales between 3 and 400,000.
  • 45 sales between 4 and 500,000.
  • 44 sales between 5 and 600,000.
  • 26 sales between 6 and 700,000.
  • 10 sales between 7 and 800,000.
  • 9 sales between 8 and 900,000
  • 5 sales. between 9 and 1 million.
  • 16 sales between 1 and 2 million.
  • 3 sales between 2 and 3 million.
  • 2 sales between 3 and 4 million.

There is always opportunity in any market trend. Creativity wins the day in a discretionary region. A buyer’s market means lots of inventory and few buyers. A seller’s market means little inventory and lots of buyers seeking.

September 2015, Market Analysis

September 2015, Market Analysis

Salt Spring Island, 2015

Salt Spring Island, 2015


Real estate is always a sure-fire conversation starter. “What’s the market doing?” is a classic opener.

For those who have been holding secondary homes/recreational properties, during an almost eight year downturn, it’s welcome news indeed that the answer is now “Definitely improving!”.

All markets are cyclical in nature

All markets are cyclical in nature. Sellers would prefer to sell on a high, and buyers would love to buy on a low. Recognizing pivotal market trends is a tough call. It’s usual to understand things when they have already passed by…easier to enjoy that 20/20 vision of the past.

The recreational markets are particularly difficult to call. Unlike a primary residence/city marketplace, where one lives year-round, works there, sends children to school there, the secondary home/rural marketplaces are by choice areas.

Old Scott Road

Old Scott Road

No one “has to” buy a property on a Gulf Island or in a rural community on Vancouver Island. Such a decision is totally discretionary, and does require consumer confidence in economic outcomes.

The post-Internet world we all now inhabit has changed the fabric of recreational ownership. It’s probable that 100% of such purchases start with an Internet search, and possibly that start occurs a good two years before a purchase is even seriously entertained.

That internet search puts all recreational regions on the same level. The buyer is no longer specifically targeted to one area… all such regions are now in competition with each other. Choice is huge.

The difficulty with several evenly weighted choices is that the viewer of same may put off acting. A buyer wants to “be sure”, before choosing. Why this place? What about that one? How to decide? Too many choices may mean no decision is taken.

I often think that a happy visitor experience in a recreational area can lead to a real estate purchase there. Successful tourism outcomes seem to drive all secondary home economies.

So…tourist discoveries are apparently showing their best patterns since 2007. Real estate sales volume in rural/recreational regions has improved dramatically. We may be just at the beginning of a market trending upward, in such discretionary areas. This might be the brief equilibrium moment between a buyers and a sellers market.

The allure factor that encourages a discretionary property decision might be the opportunity to live, even part-time, in a kinder gentler place. To be self-sufficient. To remember our essential selves.

May 2015, Market Analysis

May 2015, Market Analysis

“Been down so long it looks like up to me”…. The real estate song in all secondary home/discretionary markets, during the past 7 years? Perhaps.

Important when shift happens to be treading water in the current of change. No looking in the rear view mirror.

The recovery will become more even-handed

The upward shift may have begun in October last year, but slowly slowly. By February of this year, the uptick consistently strengthened in the entry level residential category.

Salt Spring Island

Salt Spring Island

Two years ago, the majority of sales were below 450,000. This year, sales volume may have doubled over same time period last year…and the price ceiling appears to have reached 800,000. All good news.

As inventory continues to thin out, buyers will have to offer closer to sellers expectations. Undeveloped land will begin to gain interest & buyers will consider building projects. Higher tier priced residential will get offers and begin a sales process that will match current entry level priced rhythms.

In other words, the recovery will become more even-handed in the discretionary regions. This overall improvement should be evident by late Summer/early Fall market.

Salt Spring Island

Salt Spring Island

The busiest March Break/Easter Weekend timeframe since 2007 took place this 2015…now every weekend continues to show activity…the signs of a secondary home market recovery are at last fully evident.

The busyness in Vancouver (a primary residence area) for the past 3 years made it difficult for sellers in discretionary coastal markets to understand the lack of action. This was true on Vancouver Island and on Sunshine Coast, as well as on the Gulf Islands. A “by choice” decision can be put on hold until confidence returns.

Early whispers of improvement were there in some discretionary areas by late Fall, 2014. Now, however, we are seeing general activity everywhere in all coastal markets, and 2015 does appear to be the year of authentic recovery.

A seller’s opportunity? Yes…but pricing has not yet stabilized to match the sales volume increase.

We are just now entering what I always see as our main sales window (mid-May to end of September). These next weeks see the beginning of boating season in this unique protected waters marine region. Many special events and important holiday weekends take place…visitor experiences bring property seekers, too.

So…authentic sales volume improvement, rising price points in those sales if lower priced options, sellers achieving close to list, diminishing inventory…it’s the turn of secondary home markets again.

Sellers who followed the market down will welcome this recovery. Real estate companies will welcome this improvement. Buyers will need to become creative in their offering process, in an effort to do their “best deal”. The old real estate adage of “you make your money when you buy” is true for all market trends…and it’s not always about price.

A buyers market is characterized by lots of inventory & few buyers. A sellers market is best described as low inventory & lots of buyers. Supply & demand always dictate pricings.